Bitcoin Price Cycle Debate: $60K Floor, Whale Signals, Options Magnet And S2F $500K Forecast
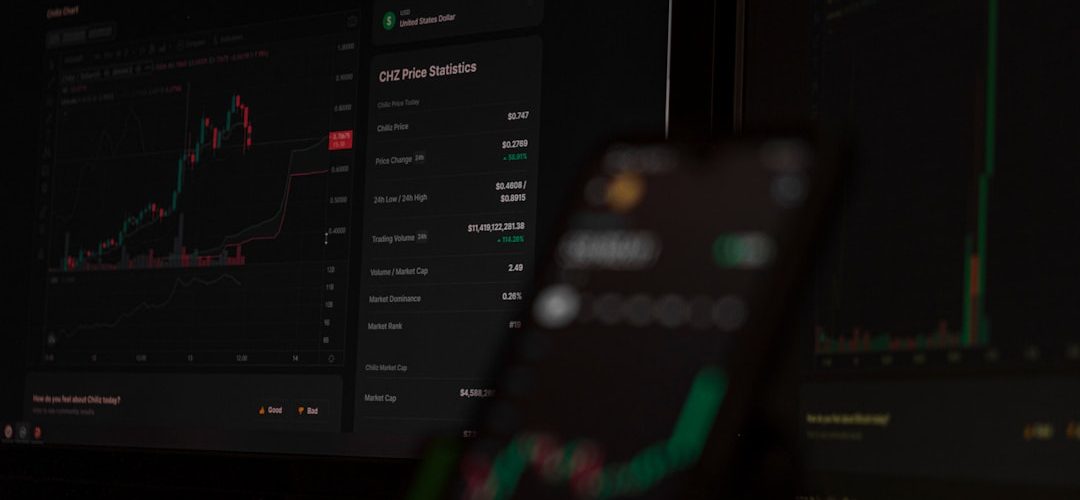
Bitcoin’s price cycle debate has intensified through the first week of March 2026, with the asset trading at $67,392, roughly 46% below its October 2025 peak above $126,000, as analysts, on-chain data, and derivatives positioning all point toward a market at a genuine structural inflection. The convergence of macro stress, options mechanics, and competing cycle models makes this one of the more analytically rich periods in recent memory. Understanding what each signal is actually measuring matters more here than picking a directional headline.
Five Months of Losses and a Correlation Problem
Bitcoin has now recorded five consecutive months of declining prices since October 2025, including a loss of approximately 15% in February alone. That drawdown sequence is not unprecedented in post-halving cycles, but the composition of the selling pressure deserves careful examination.
The 30-day rolling correlation between Bitcoin and the S&P 500 stood at 0.55 as of March 1, up from roughly 0.50 in October 2025. That incremental increase matters less for its absolute size than for what it confirms: Bitcoin continues to trade as a risk asset rather than as a monetary hedge. Gold, by contrast, has broken above $5,000 per ounce, driven by geopolitical demand from the US-Iran conflict, Gulf shipping disruptions through the Strait of Hormuz, and persistent fiscal pressure across developed economies. The divergence between gold’s safe-haven premium and Bitcoin’s equity-correlated behavior explains much of the institutional rotation visible in the data. Asset managers reducing risk exposure have, rationally, favored gold over Bitcoin when the objective is portfolio defensiveness.
This is not a structural failure of Bitcoin’s investment thesis. It is, however, a cycle-phase reality that analysts should model honestly rather than dismiss.





The $60,000 Level: Why It Is Genuinely Significant
Multiple technical and on-chain frameworks converge on $60,000 as the critical support zone for this cycle. Analyst Michaël van de Poppe identified this level as the line in the sand in his March 8 assessment, tying its importance partly to the behavior of gold and silver. His logic is straightforward: if precious metals cool and capital rotates back toward risk assets, a return to recent highs becomes plausible within a week or two; if they do not, $60,000 becomes the test.
The on-chain case for that level is structural. More than 400,000 BTC accumulated on-chain between $60,000 and $70,000 during recent price declines, creating a dense cost-basis cluster that markets typically respect. Trader Merlijn The Trader framed this through a cycle lens, observing that after each blow-off top, including the early October high above $126,000, price tends to return to the macro trendline, which currently runs near $60,000. His point is not bearish in isolation; he notes that as long as that level holds, the broader cycle structure remains intact. A sustained break below $50,000 would represent a materially different signal, one that would challenge the operating assumptions of most institutional holders.
What the Derivatives Market Actually Showed
The most analytically precise data from this period came from derivatives. On February 28, perpetual futures funding rates on Bitcoin fell to approximately negative 6%, among the most negative readings in three months. Simultaneously, BTC-denominated open interest rose from roughly 113,380 BTC to 120,260 BTC since January. That combination, very negative funding alongside rising open interest, signals a market that is both heavily hedged to the downside and increasingly leveraged. It is the conditions for a potential short squeeze, not a guarantee of one, but a precondition.
The $70,000 level has functioned as an options magnet. Open interest at that strike exceeded $13 billion, and the delta-hedging flows associated with that positioning created mechanical gravity around the price. When the initial shock from the Iran conflict and Hormuz disruptions caused Bitcoin to drop, the rebound back toward $70,000 was not purely sentiment-driven. Dealers managing options books were rebalancing their hedges as price moved, generating buying pressure that pulled the asset back toward the crowded strike zone. This is a well-documented phenomenon in equity options markets and is increasingly relevant to Bitcoin as the derivatives market matures.
On-chain analytics platform CryptoQuant provided additional texture. Demand contraction, measured by apparent spot demand, narrowed from approximately negative 136,000 BTC at the start of 2026 to around negative 25,000 BTC by early March. Long-term holder outflows dropped to roughly 276,000 BTC in the most recent thirty-day period, compared to 904,000 BTC in November 2025, the lowest monthly figure since June 2025. The Coinbase Premium Index also moved into positive territory, suggesting stronger buying interest from US-based participants. Taken together, these signals are consistent with stabilization rather than capitulation, though CryptoQuant’s Bull Score Index at approximately 10 out of 100 warns against treating the recent relief rally as the beginning of a new leg higher.
Whale Behavior and the Divergence Signal
One noteworthy development was the capitulation of a significant Bitcoin whale, which saw an estimated $19 million loss realized after five months of holding. Jane Street has also been identified in connection with Bitcoin selling activity. What makes this period analytically interesting is the divergence: large holders are distributing into strength while smaller participants accumulate. This pattern has historically preceded further downside, and the Crypto Fear and Greed Index dropping to 12, well inside extreme fear territory, reinforces that the broader market remains fragile.
Against this, Strategy’s Michael Saylor has signaled what may be the company’s 101st Bitcoin purchase. Corporate treasury accumulation at these price levels, regardless of near-term sentiment, reflects a longer-duration investment thesis that is not sensitive to monthly funding rate fluctuations.
Competing Cycle Frameworks: S2F, Bear Market Timing, and Institutional Targets
The range of cycle forecasts in circulation reflects genuine analytical disagreement, not noise. PlanB’s updated Stock-to-Flow model projects a cycle average price of $500,000 by 2028, a figure that implies several multiples of appreciation from current levels. S2F’s track record through prior halvings was strong; its performance in the 2021 and 2024 cycles was more contested, and the model abstracts away demand-side variables that have grown more influential as institutional participation has increased.
Bernstein and Standard Chartered both carry $150,000 price targets for late 2026, a considerably more conservative projection that reflects a structural bull case without requiring scarcity mechanics alone to drive price. On-chain analyst Willy Woo offered the most cautious near-term read, warning that a potential rally into the mid-$80,000 range could constitute a bull trap and that the bear market is in its middle phase, with a possible duration extending to the end of April. His framework is liquidity-driven rather than price-level-driven, which is an important methodological distinction.
Separately, analyst CW flagged that the Bitcoin Inter-exchange Flow Pulse metric has formed a golden cross, a signal that preceded explosive moves in 2019 and 2023, though with a lag of 30 to 40 days in each historical instance. If the historical pattern holds, March’s choppiness may resolve into a stronger directional move in April or May.
Macro Overlay: The 35% Crash Probability and Its Implications
Veteran strategist Ed Yardeni raised his probability estimate for a US stock market crash in 2026 to 35%, citing oil prices above $100 per barrel, the dollar’s best weekly performance in approximately one year, and the expansion of the Iran conflict toward Saudi Arabia. A realized equity market dislocation at that scale would almost certainly pressure Bitcoin in the near term, given the 0.55 correlation with equities. The key question for longer-duration holders is whether such a shock would also trigger the kind of monetary policy response, renewed liquidity expansion, and dollar weakness that has historically benefited Bitcoin on a 12 to 18 month horizon. The 2022-to-2023 cycle offers the most recent template: Bitcoin fell sharply alongside equities in 2022, then recovered sharply when the Federal Reserve signaled a pivot.
The structural case for Bitcoin remains intact. The near-term price path depends heavily on whether $60,000 holds, whether ETF inflows stabilize, and whether macro conditions evolve in a way that allows risk capital to return. Those are conditional probabilities, not certainties, and the data available as of March 9, 2026 supports a posture of cautious engagement rather than either panic or uncritical bullishness. Positioning accordingly, with clear levels in mind and an honest assessment of the liquidity environment, is the rational response to a market that is genuinely uncertain rather than obviously broken.