Bitcoin Surged Past $75,000 on Short Squeeze and ETF Inflows, Then Pulled Back Below the Level
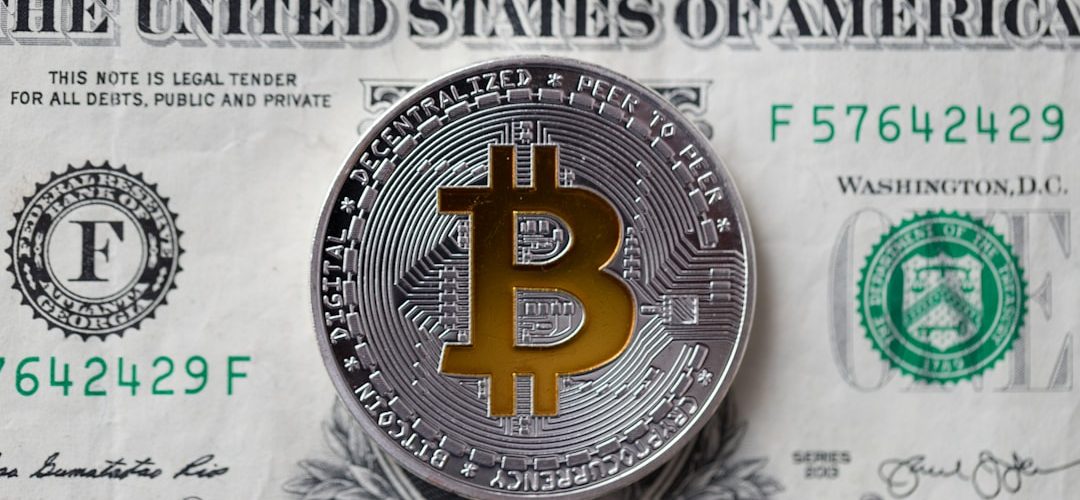
Bitcoin reached an intraday high of $75,937 on Tuesday, its strongest print since early February, before retreating to trade near $74,314, up 0.95% over the prior 24 hours. The move encapsulates the central tension in this market: a recovery that is real in its magnitude but not yet confirmed in its structural composition. Understanding what drove the surge, and why it faded, requires separating the mechanical from the fundamental.
The immediate catalyst was a derivatives-driven liquidation cascade. According to data from The Block, the broader crypto market absorbed $609 million in liquidations over a 24-hour window, with short positions accounting for $485 million of that total. Short liquidations of that scale do not reflect organic demand so much as forced buying; traders who had positioned for continued weakness were squeezed out of their positions as price rose, and their exit orders amplified the upside move mechanically. That dynamic is self-limiting by definition. Once the overhang of short interest clears, the incremental buying pressure it generates dissipates.
The Structural Underpinning: ETF Flows and Corporate Accumulation
Separating the derivatives noise from the underlying demand picture is the more analytically important task. On that front, the evidence is considerably more constructive. Bitcoin spot ETFs recorded $767 million in net inflows for the week of March 9 to 13, marking the first unbroken five-session inflow streak for BTC ETF products in all of 2026, according to SosoValue data. BlackRock’s IBIT was responsible for $600.1 million of that total, representing more than 78% of net BTC ETF inflows across all competing products. Grayscale’s GBTC remained the only meaningful source of outflows at $25.9 million for the week, a figure that has shrunk considerably relative to its 2024 redemption pace.
Bernstein analysts, in a March 16 research note, framed this as a structural ownership shift rather than a tactical positioning event. Institutional vehicles, including spot ETFs and corporate treasury programs, now control approximately 6.1% of Bitcoin’s total circulating supply. Coins inactive for over a year account for roughly 60% of supply, a figure consistent with a mature long-term holder base that is not responsive to short-term price volatility. Bitwise CIO Matt Hougan offered corroborating data: Bitcoin ETFs accumulated approximately $60 billion in net flows from their January 2024 launch through October 2025, and even after a price decline of roughly 50% from those highs, net outflows since October 2025 have totalled less than $10 billion. That retention rate is notable and speaks to the quality of the capital that entered the product.
On the corporate side, Strategy disclosed the purchase of 22,337 additional Bitcoin for approximately $1.57 billion, bringing its total holdings to 761,068 BTC. Separately, Tokyo-listed Metaplanet secured approximately $255 million from global investors to expand its own Bitcoin treasury position. These are not reactive trades; they represent precommitted allocation frameworks that operate largely independently of short-term price levels, providing a relatively inelastic demand floor that did not exist in prior cycles. For additional context on how this institutional accumulation narrative developed through early March, the Bitcoin $1 million thesis and ETF inflow discussion published here on March 15 remains relevant reading.





Volume Delta Recovery on Spot Exchanges
Beyond derivatives mechanics and institutional flows, spot exchange data offers a more granular signal about the balance of buyers and sellers. Analyst Darkfost noted that the 30-day moving average volume delta on Binance stood at negative $145 million on February 16, with Coinbase registering negative $88 million over the same period. Both figures reflected coordinated sell-side dominance across retail and institutional participants during that stretch. As of March 17, those same averages had moved into positive territory: Binance showed approximately $21 million and Coinbase approximately $14 million on the buy side.
The reversal is modest and does not yet constitute confirmation of a sustained breakout. The absolute values remain small relative to the exchange’s total volume throughput. However, the directional shift matters because it indicates that the sell-side capitulation that characterised February has not simply been replaced by indifference; there is active buyer participation returning to the spot market. Thin liquidity conditions mean these relatively small positive deltas can still move price more than they would in a deeper market, which cuts both ways.
Derivatives Positioning Remains Cautiously Bearish Despite the Rally
The disconnect between price action and professional positioning is worth examining carefully. Despite Bitcoin’s 22.5% recovery from its February low near $60,000, derivatives markets are not fully reflecting bullish conviction. Options open interest has concentrated heavily at the $75,000 strike ahead of the March 27 expiry, a configuration that reflects binary expectations rather than directional confidence. Traders are pricing for a decisive move in either direction, not a smooth continuation higher.
CryptoQuant’s Integrated Market Index did reach 96 on March 16, its highest reading in 30 days, and analyst Axel Adler noted the model had exited a bearish regime that lasted approximately 178 hours. Bitcoin’s current spot price of $74,314 sits roughly $4,300 above the model’s 30-day fair value estimate of approximately $70,000. That premium can persist during periods of elevated demand, but it also represents a gap that tends to close when marginal buying pressure eases. Cointelegraph’s coverage noted that professional traders continue to hedge against downside even as price reclaims six-week highs, a posture that reflects memory of multiple failed recoveries during the 2022 cycle.
Macro Context: FOMC, Hormuz, and Cross-Asset Divergence
The macro backdrop has shifted modestly but not decisively in Bitcoin’s favour. Reports over the weekend that two commercial tankers transited the Strait of Hormuz for the first time since the Iran-Israel conflict escalated provided a partial easing of energy supply fears, contributing to lower oil prices and a brief improvement in risk appetite across equities and commodities. Bitcoin benefited from that risk-on window but, notably, held its gains better than equities when sentiment cooled, a divergence that multiple analysts have flagged as evidence of a maturing safe-haven component in its demand profile.
The Federal Reserve’s upcoming FOMC meeting carries a market-implied probability of approximately 99% for no rate change. The decision itself is therefore not the variable; the forward guidance language is. Any signal that the Fed is considering reintroducing a rate-hiking bias would weigh on risk assets broadly, and Bitcoin, despite its evolving characteristics, remains sensitive to that transmission channel. CME gap analysis identifies the $83,000 to $84,000 zone as a technical target where the Bull Market Support band also converges, but that level remains roughly 12% above current prices and depends on macro conditions not deteriorating.
What Confirmation Would Actually Look Like
A derivatives-driven surge past $75,000 that fades back below the level within hours is, on its own, an insufficient basis for concluding a new bull phase has begun. The conditions that would shift that assessment are specific. Sustained daily closes above $75,000, ideally accompanied by continued positive volume delta on both Binance and Coinbase, would indicate that spot buyers are absorbing supply at elevated prices rather than simply following forced short covering. A continuation of the ETF inflow streak beyond a single week would provide further structural support. Conversely, the Integrated Market Index falling back below 55 or a renewed surge in exchange inflows from long-term holder wallets would suggest the rally is distributing into strength.
The power-law model, though a longer-horizon tool, adds useful framing. Its current centerline sits near $124,477 with a floor around $52,280. Bitcoin at $74,314 trades well below the trend’s central tendency, which means the long-run structural argument for higher prices remains intact even without an immediate breakout. The more immediate question is whether the confluence of institutional flows, corporate accumulation, and improving spot demand can sustain price in a range that eventually compresses the overhang of supply between current levels and the $80,000 zone. That process is likely to take weeks, not days, and will be tested by every macro headline that crosses in the interim.
The rally that unfolded between March 16 and 17 was meaningful in its composition, even if the intraday peak proved unsustainable. The structural inputs, primarily ETF inflow persistence and corporate accumulation at scale, are of a different quality than the retail-driven recoveries that characterised earlier cycles. Whether that quality is sufficient to anchor price above key resistance levels is the question this market is now in the process of answering.