Bitcoin Options Flash Extreme Fear as Trump’s Iran Ultimatum Sends BTC to $68,957
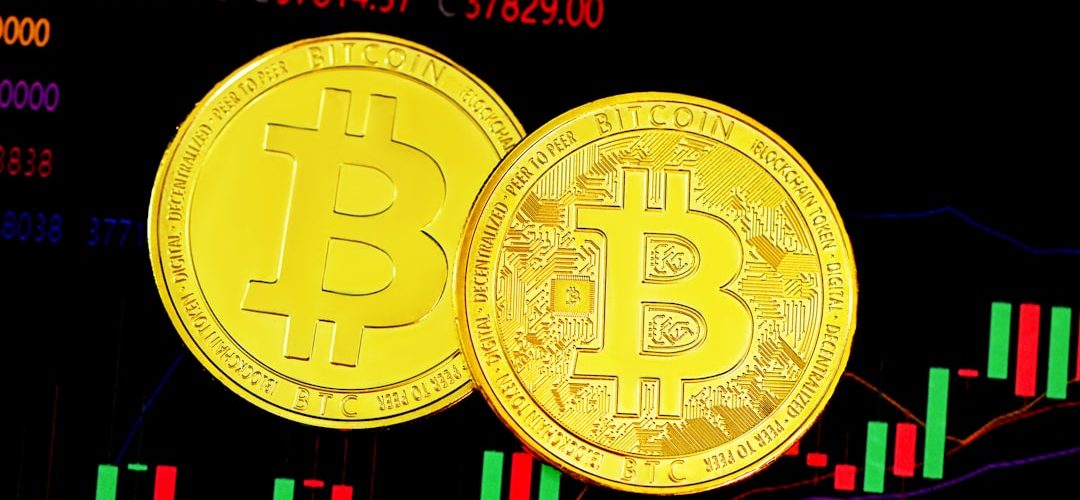
Bitcoin fell to $68,957, down 2.37% in 24 hours, after President Donald Trump issued a 48-hour ultimatum threatening to destroy Iran’s power plants unless the Strait of Hormuz is fully reopened. The move triggered over $299 million in liquidations across crypto markets and exposed a market already showing the deepest defensive positioning in options since June 2021. Three converging signals — a geopolitical shock, record hedging demand, and a historic miner selldown — now form a coherent case for sustained pressure on BTC.
Trump’s Ultimatum, $299 Million in Liquidations, and the Decoupling That Preceded It All
The sequence of events that produced Sunday’s price drop began with a whipsaw in U.S. foreign policy. On Friday at 3:40 p.m. ET, Trump stated he did not want a ceasefire with Iran. By 5:15 p.m. the same day, the White House was reportedly “considering winding down” the conflict. By Saturday morning, Axios was reporting peace talks were being planned. Then, on Sunday, Trump posted a direct threat: “If Iran doesn’t FULLY OPEN, WITHOUT THREAT, the Strait of Hormuz, within 48 HOURS from this exact point in time, the United States of America will hit and obliterate their various POWER PLANTS, STARTING WITH THE BIGGEST ONE FIRST.” The Kobeissi Letter tracked that entire reversal across 36 hours and noted in a social media post that over $240 million in leveraged crypto positions were liquidated within 60 minutes of the threat going public.
Bitcoin had been holding above $70,000 through Saturday and briefly tested $71,000 before the collapse. On Bitstamp and Binance, the low printed at $68,200. CoinDesk confirmed total liquidations reached $299 million, with long positions accounting for 85% of the damage. Ether slipped beneath $2,100 and XRP fell below $1.40 before both staged minor recoveries. The speed and severity of the move was not random: it landed on a market whose structure had already been weakening for weeks.
That structural weakness is most visible in how Bitcoin has been behaving relative to equities. According to data cited by Blockonomi analyst Darkfost, Bitcoin has now entered its longest period of divergence from the S&P 500 since 2020. The break began in October, when a single session erased nearly 70,000 BTC in open interest and reset derivatives exposure to levels last seen in April 2025. Since that unwind, Bitcoin has continued to decline while the S&P 500 held near its highs. That separation persisted for months before the current week, when equities finally joined the retreat: Cointelegraph reported that Bitcoin, the S&P 500, the Dow, the Nasdaq, and gold are all down nearly 5% on the week, while crude oil has risen 7.30% and is up 53% since the U.S.-Israel-Iran conflict began on February 28. The earlier decoupling, as covered in our prior analysis of how the Iran conflict reshapes asset hierarchies, was Bitcoin moving first; equities are now catching up.





Options Pricing, Miner Capitulation, and What the On-Chain Evidence Actually Shows
Before Sunday’s price drop arrived, the options market had already been sounding an alarm that deserves careful examination. VanEck’s mid-March Bitcoin ChainCheck report, published in the days prior, documented that the put/call open interest ratio peaked at 0.84 and averaged 0.77 over the preceding month. That average reading sits in the 91st percentile of all observations recorded since mid-2019. The last time the ratio reached comparable levels was June 2021, when China banned Bitcoin mining and forced a mass relocation of hashrate. The parallel is worth stating plainly: the current defensive positioning in options rivals one of the most structurally disruptive events in Bitcoin’s mining history.
The premium data sharpens the picture further. Total put premiums over the past 30 days reached approximately $685 million. Even though that figure represents a 24% month-over-month decline, it still exceeds 77% of all monthly readings recorded since early 2025. Most strikingly, put premiums relative to spot volume hit an all-time high of roughly 4 basis points, approximately three times the levels seen after the Terra/Luna collapse in mid-2022. As Decrypt reported, this premium has persisted even as spot prices stabilized, which means the hedging demand is not simply a reactive response to price movement. It reflects a deliberate, sustained decision by market participants to pay for downside insurance at historically elevated rates. Implied volatility on puts averaged around 66, sitting approximately 16 points above realized volatility, which itself dropped from 80 to 50 over the period — a sign that actual price movement calmed while the fear of future movement did not.
On the miner side, the data from VanEck’s report tells a story of sustained, grinding liquidation rather than panic selling. Aggregate miner BTC balances currently sit at 684,000 BTC, down only 0.5% year-over-year. That sounds stable until you account for the math: roughly 164,000 new BTC were mined over the same period and effectively sold. Miners have been selling nearly all newly issued supply for the past year, keeping their aggregate balance roughly flat only because new production is being liquidated in near real-time. Miner revenues declined 11% over the past month, mining equities fell approximately 7%, and miner outflows to exchanges rose 1% in BTC terms. The picture is not one of capitulation but of operators managing reserves carefully under sustained profitability pressure.
The broader on-chain picture compounds the concern. Transfer volume fell 31% over the past month, total daily fees dropped 27%, daily active addresses declined 5%, and mean transaction fees fell 40%. The Bitcoin momentum indicator tracked by on-chain analyst GugaOnChain dropped to 20.0, which that analyst described as confirming extreme weakness and the absence of Wall Street re-engagement at current prices. The Coinbase Premium Gap fell to -5.82, reflecting weaker buying pressure from American institutional participants. Two consecutive days of spot ETF outflows totaling $253.7 million confirm that institutional capital has not yet returned, though it is worth being precise here: $254 million in ETF outflows across two sessions is not a large enough figure by itself to confirm a bearish pivot from institutional allocators. As Cointelegraph noted, the outflow total remains relatively modest. The options data, not the ETF data, is the stronger signal of sentiment.
Analyst Benjamin Cowen offered the clearest statement of the structural case on record. In a recent YouTube update, Cowen argued that Bitcoin’s rally into March does not constitute a trend reversal, pointing to a historical pattern in which BTC consistently taps lows in February during bear market years, including 2014, 2018, 2022, and now 2026, before staging rallies that ultimately fail. His stated threshold for changing that view is unambiguous: “As long as Bitcoin is trading below $83,000, nothing’s really changed… this is still just technically a lower high structure.” At $68,957, Bitcoin is more than $14,000 below that line.
VanEck’s own historical analysis offers a counterpoint that should not be ignored. Readings at the current put/call skew decile have historically preceded average 90-day BTC returns of +13.2%, the strongest of all skew deciles. The 360-day average from similar readings comes in at +133.2%. That data point does not invalidate the short-term bearish signals; it simply establishes that extreme defensive positioning, historically, has tended to precede recovery rather than follow it. What the data cannot tell us is whether the geopolitical variable — an active armed conflict, a 48-hour ultimatum, and an oil price up 53% since February 28 — fits within the historical sample those averages were drawn from. It almost certainly does not. The evidence built here points to a market under genuine structural stress, priced defensively for good reason, and now absorbing an external shock whose duration and severity remain unresolved. The 48-hour clock on Trump’s Hormuz ultimatum runs out Monday. Until that deadline passes and markets can assess the response, the case for caution remains stronger than the case for positioning against it.