Bitcoin Falls Below $80K as Record Negative Funding Rates and Iran Strike Collide

Bitcoin is trading at $79,688, down 2.22% over the past 24 hours, after U.S. forces struck Iranian targets on Thursday, triggering a pullback from the week’s high of $82,800 and pushing the asset back below a threshold it had only recently reclaimed. The selloff is structurally more interesting than its headline number suggests: futures funding rates have now been negative for 67 consecutive days, the longest such streak in a decade according to K33 Research, meaning the market has been leaning short even as price ground higher. That combination, a geopolitical catalyst meeting an already-exhausted derivatives market, explains the speed and character of the current decline better than either factor does in isolation.
What the Weekly Structure Actually Shows
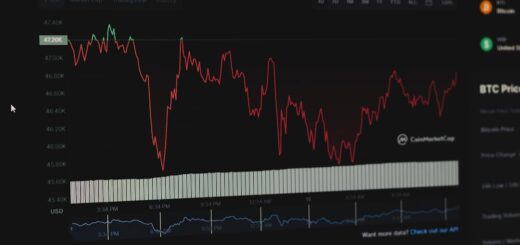
To understand where Bitcoin stands, it is necessary to read the weekly chart rather than the daily one. BTC opened the week near $76,960, advanced to a multi-month peak around $82,800 by Wednesday, and has since returned roughly $3,100 of those gains. The weekly candle is now forming what technicians would describe as a shooting star or bearish rejection wick, a pattern that typically signals sellers absorbed demand at elevated levels rather than allowing consolidation to develop. That is a more cautious read than any single 24-hour session would imply.
The $80,000 level has now re-emerged as the dividing line between a healthy consolidation and something more structurally worrying. A weekly close above it preserves the thesis that Bitcoin reclaimed a major psychological level and is digesting gains before another attempt at the 200-day moving average, which sits in the $82,200 to $83,200 range depending on the data source. A close below $80,000 would mean BTC failed to hold any of its advance above that level on a weekly basis, a meaningful technical failure. At time of writing, the close remains unresolved.
The Geopolitical Catalyst and Its Limits
Thursday’s news that U.S. forces fired on Iranian targets, following reported attacks on American naval destroyers in the Strait of Hormuz, provided the immediate trigger for the decline. President Trump described the action as a “love tap” and stated the ceasefire with Iran remained in effect, while Brent crude climbed 1.2% to approximately $101 per barrel on the escalation. Equity markets took the news with relative calm: the MSCI All Country World Index slipped 0.3%, Asian shares fell 1.2% from a record close, and Wall Street futures were modestly higher in early trading, suggesting the broader risk-off response was contained rather than systemic.
For Bitcoin, the Iran factor matters but should not be overstated as the primary driver. The Iran-Hormuz dynamic has been a recurring source of volatility in this market cycle, and each episode has so far proved shorter-lived than the initial reaction implied. What the geopolitical news did on Thursday was supply a reason to sell into a market that was already technically extended. The MSCI data and Wall Street futures together suggest that what is happening in crypto is primarily an internal market event rather than a macro contagion.
Funding Rates, Liquidations, and What 67 Days of Negative Carry Means
The most structurally significant data point in this episode is the funding rate streak. According to K33 Research, Bitcoin futures funding rates have been negative for 67 consecutive days, meaning traders holding short positions have been paying a fee to longs for the privilege of maintaining those shorts. That is the longest such streak in ten years. In a healthy bull market, funding rates are typically positive because the majority of leveraged exposure sits on the long side. A 67-day run of negative funding while price has simultaneously ground higher from the mid-$70,000s means that the market has been climbing a genuine wall of short positions.
The mechanical consequence of that setup is well understood: if Bitcoin breaks decisively above the 200-day moving average, the cost of maintaining short positions becomes prohibitive and forced covering accelerates the move higher. That is the short squeeze thesis. The complication is that the same negative funding environment can suppress price in the short term, because derivatives traders are structurally positioned against the asset. On Thursday, as CoinDesk reported, more than $331 million in bullish positions were liquidated over 24 hours, including nearly $100 million within a two-hour window as Bitcoin broke below key support levels. That kind of forced unwind compresses funding further and temporarily validates the short-side thesis even as the longer-term structural picture remains constructive.
FxPro chief market analyst Alex Kuptsikevich characterised the pause in measured terms. “Bitcoin rose to $82,800 on Wednesday, approaching but not breaking through the 200-day moving average at $83,200,” he wrote in a note. “From its local highs, the leading cryptocurrency retreated. The daily RSI hit overbought territory above 70, and the previous three times this happened, in August, October and January, were followed by sharp selloffs. It is logical that market participants are taking a breather to assess the situation and gather strength.” That framing is accurate and consistent with the data; a momentum indicator reaching 70 in a market still below its key moving average is a signal worth respecting.
On-Chain Conditions Remain Structurally Sound
The on-chain picture presents a meaningful counterweight to the technical weakness. At time of writing, the Bitcoin network is processing activity across approximately 497,326 active addresses in the past 24 hours and sustaining a hash rate of 935.1 EH/s, figures that reflect no deterioration in network health or miner confidence. Exchange reserves remain at seven-year lows, and whale wallets holding 1,000 BTC or more net-bought 270,000 BTC over the past 30 days, described by one analyst as the largest monthly accumulation since 2013. Approximately 47,000 BTC were also withdrawn from centralised exchanges over the same period, further tightening available spot supply.
Glassnode data shows that Bitcoin has cleared two meaningful on-chain price thresholds: the True Market Mean at $78,200 and the Short-Term Holder Cost Basis at $79,100. Trading above both levels places most recent buyers in unrealised profit, which historically reduces the urgency to sell. The complication flagged by analyst Ali Charts is the $80,300 level, which corresponds to the average acquisition cost for newer whale entities that accumulated over the past 155 days. When Bitcoin trades below that figure, those whales are underwater on their positions, which creates at least the theoretical pressure of break-even selling if the period extends.
The Short-Term Holder SOPR metric rising above 1.0 confirms that profit-taking among recent buyers has accelerated. Realised profits among short-term holders reportedly reached their highest level since December 2025 earlier this week. That is not a bearish signal in isolation; it is a natural consequence of a 30%-plus move from April’s lows near $63,000 to $82,800. Some degree of distribution at elevated levels is mechanically expected and does not by itself negate the longer-term accumulation data.
ETF Flows as the Structural Anchor
The institutional layer of demand has been the most consistent counterforce throughout this correction. Weekly spot Bitcoin ETF net inflows reached $1.105 billion, the strongest performance since January, across five consecutive positive sessions through Wednesday. That streak accumulated $1.69 billion in total, the longest run of sustained inflows since July 2025. Wednesday alone added $46.3 million in net capital. BlackRock’s iShares Bitcoin Trust and Fidelity’s FBTC have both contributed meaningfully to those figures in recent sessions.
The ETF flow pattern during the initial $80,000 reclaim earlier in the week was notably different from the outflow episode that preceded it; a comparison worth holding in mind when assessing whether institutional appetite has shifted. Swissblock analysis captures the current dynamic accurately: “ETF demand is absorbing selling pressure. This remains a flow-driven breakout.” That framing suggests the $80,000 to $82,800 range is a zone where large institutional buyers are actively competing with short-term profit-takers and geopolitical-driven sellers. The outcome of that competition, rather than any single headline, will determine the next sustained directional move.
A Directional Assessment for the Sessions Ahead
The data, taken together, supports a structurally constructive medium-term view while acknowledging genuine short-term risk. The bear case rests on three real factors: two rejections from the 200-day moving average zone, a weekly candle that has formed a bearish wick, and the Iran escalation supplying a reason to reduce risk into the weekend. The $78,000 to $76,000 range, where the daily fair value gap aligns with the 200-day exponential moving average, is the next credible support zone if $79,000 gives way cleanly.
The bull case is stronger on a longer horizon and rests on more durable foundations: record-low exchange reserves, the largest whale accumulation in over a decade, 67 days of negative funding that keep the short squeeze on the table, nearly $1.7 billion in institutional ETF inflows over five sessions, and a network hash rate at all-time highs with 101,568 blocks remaining to the next halving. None of those conditions reverse in a two-day pullback. The question is not whether demand has evaporated, it clearly has not, but whether the geopolitical overhang and the technical failure at $83,200 extend the corrective phase long enough to retest the $76,000 to $78,000 support zone.
The likeliest outcome, given the weight of the structural data, is that any extension lower into that support range is absorbed rather than extended. The short squeeze mechanism that K33 identified is not a prediction; it is a mathematical consequence of 67 days of shorts paying to hold positions while price has remained above their entries. That pressure does not dissipate unless Bitcoin falls far enough to close out those positions at a loss, which would require a move well below the $74,700 level cited by trader Killa XBT as a deeper support corridor. An incoming Fed Chair transition on May 15 adds one further uncertainty variable, but that event is dateable and therefore manageable. The more impactful near-term variable is whether Friday’s weekly close holds $80,000, and on current trajectory, that outcome looks marginal rather than assured. A close below it argues for patience rather than urgency, but not for abandoning the structural thesis that has been building since April’s lows.