Bitcoin Recovers to $70,000 as Geopolitical Fears Recede and Derivatives Reset
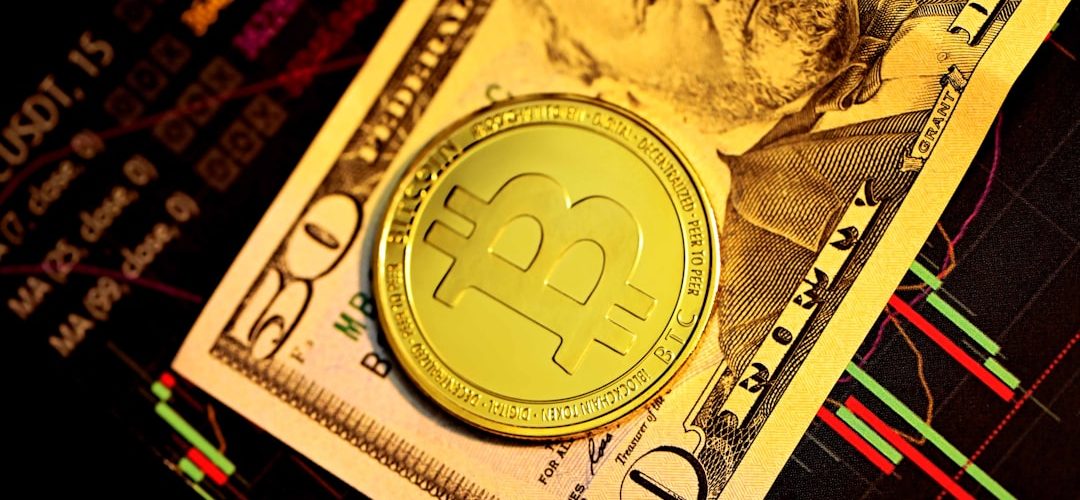
Bitcoin has rebounded to the $70,000 level after a sharp multi-week correction, with the recovery driven by a confluence of easing geopolitical pressure, a significant derivatives deleveraging cycle, short-position liquidations, and renewed institutional inflows through spot ETF products. At press time, BTC was trading at $69,400, up 0.52% over the prior 24 hours, after briefly touching $71,220 during Tuesday’s Asian session.
The Macro Trigger: Oil’s Reversal and Iran Rhetoric
The proximate catalyst for Bitcoin’s recovery was a dramatic reversal in crude oil prices. Brent crude had spiked to approximately $119.50 per barrel as fears mounted over potential supply disruptions through the Strait of Hormuz. That spike correlated directly with Bitcoin’s decline from the mid-$70,000s to a weekend low near $65,000, a drawdown of roughly 12% over a compressed timeframe.
The reversal came on Monday when President Donald Trump, speaking to CBS News, suggested the conflict involving Iran was “very complete, pretty much,” adding that the US military had struck more than 3,000 Iranian targets in its first week of operations. Oil subsequently retreated to approximately $90 per barrel, representing a 28% decline from its intraday peak. Risk assets responded immediately. The S&P 500 closed 0.83% higher, and Bitcoin climbed roughly 4% overnight, reclaiming the psychologically significant $70,000 threshold during early Asian trading on Tuesday.
It is important to qualify this macro dynamic carefully. Trump’s statements were internally contradictory; he told reporters the war was nearly over while subsequently posting more aggressive rhetoric on social media. That ambiguity means the geopolitical risk premium has compressed but has not been fully removed. Oil futures remain well above their pre-conflict levels, and any renewed supply disruption would likely reimpose pressure on risk sentiment across asset classes, including Bitcoin.





Derivatives Deleveraging: A Structural Reset
Beneath the surface of price recovery, the more consequential development may be the degree to which speculative leverage has been purged from the Bitcoin derivatives market. According to CryptoQuant data, the Bitcoin Estimated Leverage Ratio on Binance has fallen from 0.198 in February to 0.152, a move that coincides with Bitcoin’s decline from approximately $96,000 to its recent lows. That is not a marginal adjustment; it represents a meaningful compression of the ratio between futures open interest and exchange BTC reserves.
Separately, the 30-day funding rate percentile has dropped to 6%, its lowest reading since early 2023. To contextualise that figure: 94% of the prior month’s daily funding rate observations were higher than the current level. In January 2026, the average perpetual funding rate sat at approximately +0.005% per period, with the 30-day percentile above 80%, meaning long positions were being well compensated. By late February, the average had shifted to -0.021%, with several readings below -0.01% recorded on February 25, February 28, and March 4.
This configuration, where short positions are paying longs on a near-daily basis, reflects an unusually concentrated bearish positioning in perpetual futures markets. Historically, such extremes in one-sided positioning have preceded violent price dislocations rather than gradual directional moves. Between March 9 and 10 alone, more than $115 million in short positions were liquidated as price recovered through the $70,000 level. That short squeeze contributed meaningfully to the pace of recovery, though it also complicates interpretation. A recovery driven primarily by forced short covering carries less fundamental weight than one anchored in incremental spot accumulation.
On-Chain Accumulation: Encouraging but Not Yet Conclusive
Blockchain data adds a more constructive layer to the analysis. Glassnode reported that traders acquired approximately 200,000 BTC during the most recent two-week correction, with a broader figure of nearly 600,000 BTC purchased while price was below $70,000. Exchange balances have declined to all-time lows, a structural condition that reduces the immediately available sell-side supply and has historically preceded supply-constrained price appreciation.
Short-term holder market capitalisation has fallen to approximately $390 billion, down from $437 billion recorded in early April 2025. On-chain analyst Amr Taha noted that comparable declines in this metric preceded the April 2025 capitulation event, which pushed BTC toward $78,000 before a subsequent rally above $108,000. The Binance Bitcoin derivatives market index has also fallen to 0.35, a level comparable to readings observed during the July and August 2024 market lows.
However, not all on-chain signals are unambiguously positive. The Network Value to Transaction ratio has increased 77% to 41.34, indicating that price has moved without a corresponding increase in on-chain transaction activity, a pattern sometimes referred to as price without participation. The short-term holder MVRV ratio sits at 0.76, confirming that recent buyers are, on aggregate, holding unrealised losses. The Coinbase Premium is marginally negative at -0.0048, which suggests that institutional selling pressure on the US spot market has not fully abated. Glassnode noted that while momentum has “firmed modestly,” spot activity remains subdued and trading volume continues to point toward softer participation.
ETF Flows: Persistent but Uneven
Spot Bitcoin ETF products in the United States have continued to attract capital through the turbulence, though the weekly pattern reveals a more nuanced picture. According to SoSoValue data, net inflows for the week ending March 7 totalled approximately $568 million, compared to $787 million the prior week. The week was structurally divided: the first three trading days saw approximately $1.44 billion in inflows as some investors initially treated geopolitical uncertainty as a catalyst for alternative asset exposure. The final two days recorded approximately $829 million in outflows as oil prices surged and the inflation outlook deteriorated. Cumulative net inflows across all US spot Bitcoin ETF products have now exceeded $55 billion.
On March 9, net inflows recovered to $167 million, with BlackRock’s IBIT accounting for $109 million of that figure. CoinShares reported total digital asset product inflows of $619 million for the week, with Bitcoin-specific products absorbing $521 million. US-domiciled investors accounted for approximately $646 million of the weekly total, while European, Asian, and Canadian flows were collectively negative, highlighting a pronounced geographic divergence in risk appetite.
Structural Resistance and the Path Forward
From a market structure perspective, Bitcoin faces a well-defined resistance corridor between $71,800 and $72,200. This zone combines a previous swing high, a key Fibonacci retracement level, and a psychological threshold that has repeatedly capped rallies since early February. A sustained close above $71,800 would shift the technical interpretation meaningfully, opening a potential path toward the $74,500 region and, beyond that, a retest of the late-February high near $74,000.
On the downside, the $68,800 to $69,000 range has reasserted itself as near-term support following Tuesday’s price action. A failure to hold that band on a closing basis would expose the market to retests of $67,500 and, further out, the $65,000 level that several analysts have identified as the primary structural defence for the current recovery thesis.
Prediction market platform Polymarket reflected the shifting sentiment directly: the implied probability of Bitcoin reaching $75,000 in March rose from approximately 34% to 56% within a single 24-hour window as BTC reclaimed $70,000. That is a notable shift in crowd-sourced expectations, though it remains below majority certainty and should be read as sentiment data rather than a directional forecast.
The present setup warrants a disciplined interpretation. The deleveraging cycle has produced genuine structural improvements; the leverage ratio reset, the funding rate normalisation, and the on-chain accumulation figures are consistent with conditions that have historically preceded durable recoveries. What is missing is confirmatory volume. Until spot participation expands materially alongside price, the current advance is best characterised as a transitional phase rather than the initiation of a new directional trend. The interaction between crude oil futures, further geopolitical developments in the Middle East, and the cadence of ETF inflows over the coming sessions will determine whether $70,000 consolidates as a base or reverts to resistance.